Introduction
Methodology: Comparing graphic behavior with human behavior
The prior article provided an introduction to the methodology that the Author employed to establish correspondences between experiential reality and the Living Algorithm’s mathematical system. Specifically, the Author compares the behavior of graphs generated by the Living Algorithm with the behavior of humans. Pure mathematics determines the graphic behavior. Experience, social convention, and experimental findings combine to establish the validity of human behavior.
How does the ideal Pulse of Attention behave when it is interrupted?
It is now time to put this methodology into practice. Specifically we are going to examine the behavior of the ideal Pulse of Attention when it is interrupted. We then compare this graphic behavior with human behavior that has been scientifically verified.
Review of Experiment based upon the Creative Pulse, a.k.a. the Pulse of Attention
The following discourse reviews material that has been dealt with in more depth in an earlier notebook. At this time in his project, the Author was investigating creative sessions. Accordingly, he named his mathematical model the Creative Pulse. As we shall see, the Creative Pulse and the Pulse of Attention are one and the same – a graceful mathematical curve produced by the Living Algorithm. Let the exploration commence.
The Creative Pulse Experiment
Interruption Phenomenon inspires questions.
The Author noticed that a small interruption seemed to have a large negative impact on his creative sessions. He named this empirical event the Interruption Phenomenon. This human behavior aroused his intense curiosity. This led to a complex of questions.
What is the best way to engage in creative activity? Do interruptions have an effect on the quality of a creative session? Could a mathematical perspective shed light on these questions? How might a mathematical form model a creative session? How would a mathematical model operationally define an interruption to that session? Is it possible that mathematics could clarify the relationship between interruptions and achieving creative inspiration?
Muse reveals some clues.
After years of pondering these questions, his Muse finally revealed some clues. The Author began to see a way to develop a mathematical model that addresses interruptions to a creative session.
Author’s focus shifts to the optimal context for a creative session.
The Author’s focus began to center on the conditions necessary to produce an optimal creative experience. His concern shifted from the essential nature of creative inspiration to an interest in the dynamics of sustained attention. This shift centered on an effort to identify the context that generates a high quality performance. He had a strong feeling that the momentum of a data stream played a significant part in understanding this context.
Data Stream of Creative Session: 1’s for Attention, 0s for Interruptions
His insight was simple. Characterize the creative session as a data stream. Employ ‘1’s when attention is focused upon the project and employ ‘0’s when attention is interrupted. In this mathematical model, Attention is either ‘on’ or ‘off’.
Author needs Satisfactory Mathematical System
Associating a creative session with a data stream, where ‘1’s are Attention and ‘0’s are Interruptions was the first step. The Author now had to find a mathematical system that could capture his sense of the disproportionate effect of interruptions upon the conditions that produce a quality creative session. The Creative Pulse Notebook (2002) articulated this detailed investigation.
120 minute creative session = data stream of 120 ‘1’s
His next task was to find a mathematical model that simulated an uninterrupted creative session, where the Attention of ‘1’s is never broken. To simulate a typical 2-hour creative session, the Author employed a data stream that was 120 time units (‘minutes’) in length. As such, the data stream that modeled the uninterrupted creative session would consist of a sequence of 120 ‘1’s.
Creative Pulse Graph satisfies criteria
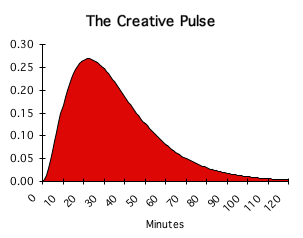
The quest for a mathematical model that would yield the appropriate results eventually resulted in the Creative Pulse Graph – the red surge at the right. For the reasons articulated in his earlier writing, the Creative Pulse satisfied the Author's requirements for an uninterrupted creative session. Reiterating for emphasis, the data that generates this idealized graph is a series of 120 consecutive ones – nothing more or less. Once these numbers are entered into our mathematically generated computer program, they produce the graph to the right.
Creativity & Inspiration not part of the Creative Pulse. Why?
Because the Author was interested in the effects of interruptions on a creative session, he named the resultant graph the Creative Pulse. Let’s take a closer look at the mathematics behind this intriguing graph.
Creative Pulse: a picture of the Momentum of Attention
What does the graph signify mathematically? More specifically, what do the two axes of the graph represent?
X-axis = Time; Y-axis = Data Stream Momentum
The horizontal axis (the x-axis) is associated with the passage of time. In this case it is ordered from 1 to 120 'minutes'. The vertical axis (the y-axis) represents the momentum of the data stream. Our data stream can only be ‘0’ or ‘1’. The values of the y-axis are relative to these values.
The Creative Pulse actually the Pulse of the Momentum of Attention
To refresh our perspective, remember that the 1’s simply represented the focus of attention – nothing more, nothing less. From personal experience, the Author felt that uninterrupted attention was the source of quality inspiration and creativity. Accordingly, he could have called the Creative Pulse the Pulse of Attention, or more specifically, the Pulse of the Momentum of Attention.
Some common everyday examples of the Pulse of Attention
With this revision in mind, we can see many everyday examples that reflect the pulse-like momentum of attention. For instance, when we hear a lecture, the momentum of our attention tends to be light during the introduction. The momentum then builds in intensity as we are introduced to new material, and then naturally falls off as we integrate and synthesize the presented information. By the end of the lecture our focus naturally wanes and then fades out.
Data Stream Momentum linked to our ability to digest and integrate information
We hold that this pulse-like momentum curve has the potential for broad applicability. It could easily apply to music performances, sporting events, or even a dinner party. In fact, the pulse of a data stream’s momentum could apply to any situation where sustained attention plays a part. In future articles, we suggest that this pulse of momentum based upon sustained attention is associated with the requirements for a memorable and engaging experience or even our ability to digest and integrate information.
What happens when Attention is interrupted?
Now that we have taken a brief glimpse at the uninterrupted Creative Pulse, let us review what happens to the momentum of the data stream when we introduce interruptions in the form of ‘0’s. What happens when Attention is interrupted?
The Creative Pulse Interrupted
Creative Pulse (red) w/Interruptions

Interruptions: Methodology & Results
Our original assumption was that the idealized graph of the Creative Pulse (red) represented an uninterrupted creative session, hence her name. What happens when this creative session is interrupted?
The methodology for answering this question was simple. Zeros were substituted for 1s in the original chain of numbers in the primary computer program – nothing more or less. In the mathematical model, each 1 represents a 'minute of creative activity' in a '2 hour session'. Accordingly, 0s are introduced as 'interruptions' to the creative session. Each 0 represents a 1-minute interruption. The impact of these 0s on the Creative Pulse is shown in the graph at right. The red area (behind the others) is the curve of the ideal Creative Pulse (an uninterrupted session of 120 ‘minutes’). The other colors represent curves that result from various interruptions to this ideal pulse. The 3 additional curves we selected represent the impact of interruptions of 1-minute (1 zero), 3-minutes (3 zeros), and 5-minutes (5 zeros). Note that as the size of the interruption grows, the negative impact on both the peak and area of the curves also grows. According to theory surrounding the Creative Pulse, this means that interruptions diminish the ideal potential of a creative session (both the quality and quantity of work). The history, description and implications of this graph are explored in the Creative Pulse Notebook.
Timing is everything
A unique feature of the graph is that timing is everything. We chose the above graph as it illustrates the most extreme case, when the impact of 'interruptions' is greatest. If 'interruptions' of the same duration occurred earlier or later in the stream of 1s, the impact would be different and less pronounced. As we shall see, timing is equally important for the Triple Pulse Graph, but in an intriguingly different way.
Cultural Evidence for the Interruption Phenomenon
At the time of the Creative Pulse Experiment, the Author had no idea if there was any evidence confirming or denying his inferences. His initial evidence was strictly anecdotal. As he broadened his search for examples, he noticed a number of cultural forms that operate on the assumption that interruptions undermine the quality of an experience. One example is the custom of locking the doors before a musical concert or a theatre performance to prevent the aggravating distraction of late arrivals. Another example is the time-out strategy in professional sports. Coaches regularly call time-outs at strategic moments. One intended effect of these time-outs is to interrupt the other team’s momentum. Both of these examples affirm the existence of cultural forms that react to the perceived effect of the Interruption Phenomenon. Would a broader search find some hard scientific evidence that supports these same harmful effects of interruptions?
Scientific Evidence for the Harm of Interruptions
In the scientific literature, we did indeed discover some empirical support for these harmful effects. The respected cognitive scientist Dr. John Medina provides compelling evidence in his book, brain rules. Dr. Medina summarizes the results of some carefully verified studies.
"Studies show that a person who is interrupted takes 50 percent longer to accomplish a task. Not only that, he or she makes up to 50 percent more errors." (Medina, brain rules, p.87)
These results lead us to an inescapable conclusion: interruptions are incredibly damaging to both the quality of our performance and our ability to complete a project. These experiments support the theory that interruptions harm the productivity of a work session and that the effects of these interruptions are disproportionate to their duration.
Summary: Creative Pulse captures the Effect of Interruptions
Let us summarize some of our findings regarding the initial phase of our project – the Creative Pulse Experiment. The Creative Pulse Graph is a purely mathematical model – based solely upon how the Living Algorithm digests information. Although originally inspired by curiosity about optimizing a creative work session, the Creative Pulse now appears to apply to a broad set of activities that require sustained attention.
We theorize that the Creative Pulse represents the ideal curve for a session where attention is uninterrupted. In a series of computer experiments we noted the disproportionate effect of interruptions on this ideal curve. This negative relationship between interruptions and a productive session is supported by personal, cultural and scientific evidence. This leads to the tentative conclusion that attention has momentum, and that the Creative Pulse somehow captures the effect of interruptions upon this momentum.
Questions regarding Living Algorithm’s connection to Interruptions
The tantalizing results from this computer experiment also raise some intriguing questions. Is this mysterious correspondence between the purely mathematical model of the Creative Pulse and the experiential/experimental reality surrounding interruptions merely a coincidence? If not, what provides the link between the Living Algorithm’s transformation and the nature of a productive session? Does it fall into the more traditional areas of explanation? Is this link a bio-chemical mechanism? Is it perhaps an, as yet, undiscovered psychological explanation that we are looking for? Or perhaps, could the Creative Pulse be a mathematical form that shapes the nature of the momentum of human cognitive attention?
If the mechanism is indeed mathematical, what does this tell us about the way in which we digest information? Might the Creative Pulse be a visual representation of a mathematical form of information digestion? If so, could the harm of interruptions be due to the mathematical manner in which we digest information? Could an interruption to the ideal Creative Pulse in our computer experiment be akin to interrupting the complex mathematical momentum of our ability to digest information?
Need more evidence to refine understanding
To even begin to address these questions, additional evidence must be accumulated to refine our understanding and substantiate our theories. This experiment showed how interruptions to the Pulse of Attention (the Creative Pulse) mimicked interruptions to a creative session. In both cases, interruptions compromised the ideal potentials. In our next article, we will consider another set of computer experiments with links to empirical reality. These experiments surround the Triple Pulse, another of the Living Algorithm’s primary transformations. The Triple Pulse is a mathematical model that develops organically from the Pulse of Attention. The Triple Pulse Experiment links this Living Algorithm transformation with human behavior regarding sleep. To provide essential context, the next article in the series, Triple Pulse Experiment: Method, examines the methodology behind these computer experiments.
Links: Personal & Narrative
For insights into the Author’s personal journey of exploration, check out Origination of the Creative Pulse.
For the emotional impetus behind the investigation, read our metaphorical narrative – Life wants to see what else the Living Algorithm can do.