The General Living Algorithm
The Living Algorithm is the algorithm for Information Dynamics, our study of the patterns of correspondence between mathematics and human behavior. In a prior article we were introduced to the essences of the Living Algorithm – her Algebra. The Living Algorithm’s sole function is digesting data streams. Her digestion process produces the rates of change (the derivatives) of any data stream. These derivatives indicate the trajectories of each data stream moment. Here she is - in her most fundamental form. She epitomizes simplicity, unassuming in her sheer elegance.
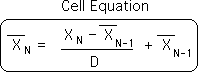
General Living Algorithm produces all the data stream derivatives
This version of the Living Algorithm computes the 1st derivative of the data stream – the ongoing Living Average. Other variations of the Living Algorithm compute the rest of the derivatives (the rates of change). All of the variations are contained within only one equation – the general Living Algorithm. The general Living Algorithm digests data streams to produce all the data stream derivatives. In other words, we employ only one algorithm - one procedure - to generate the entire system. This simplicity becomes increasingly important when we discuss the evolutionary potentials of the Living Algorithm.
Living Algorithm's Family of Derivatives – the Generations
To facilitate understanding and for ease of reference, we have chosen the metaphor of a Family to characterize these rates of change (the derivatives). This is because each derivative belongs to its own Generation. We refer to the Living Average as the Original Generation, the Mother of all future generations. Each of the other derivatives is a descendant of the Living Average and belongs to a unique Generation in the Living Algorithm's Family.
Family's Daughter & Son have their own General Equation for their family line
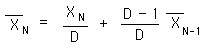
Basic Living Algorithm (Mother)
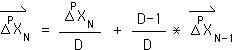
General Living Algorithm (Daughter)
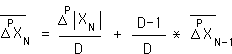
General Living Algorithm (Son)
Let us liken the derivatives in the Living Algorithm System to family members. The Living Average is the mother of two children, a son and daughter. Each of her offspring gives rise to their own family line. The Basic Living Algorithm, as noted, generates the Living Average, the mother of the family. Each branch of her family (daughter and son) has their own General Living Algorithm. Let's compare these 3 equations - shown at the right.
Basic & General Living Algorithm Similarities
There are many similarities and some significant differences. The Xs, Ns, Ds & operations are identical in each of the equations. The operations are nothing fancy – just the addition, subtraction and division of basic math. The X's without hats represent the Data from the Stream. The N's represent their position in the data stream. The X's with hats are the Living Algorithm’s Family of Derivatives. They refine the data stream by characterizing the ongoing moments. D is the mysterious Decay Factor, which determines the rate of decay. The Decay Factor is also the key to immediacy and hence to the mystery of the Living Algorithm. These elements (Xs, Ns, Ds & operations) are identical in each version of the equation.
Triangles (Rate of Change)
The only difference between the General and Basic Living Algorithm is that the General Equations contain more algebraic symbols. The General Living Algorithms contains Ps, triangles ∆, and arrows. The Basic Living Algorithm has none of these exotic symbols. Triangles (∆ delta) are a standard mathematical symbol for rate of change or difference. Hence the entire family of measures characterizes rates of change in a data stream. They are helpless before static or fixed sets.
Arrows (Direction of Change) for Directionals - the Daughter's side of the Family
The General Equations for the two sides of the family (brother & sister) only differ in one significant way. One has arrows over the Xs, while the other has bars. Arrows are a standard mathematical symbol for vectors (quantities with direction). As such, the members of one side of the family (the daughter’s) behave as vectors. They indicate the direction of the data stream that they describe. This is why this branch of the Family is called Directionals.
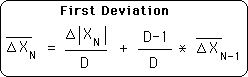
Bars (Range of Variation) for Deviation - the Son's side of the Family
The General Living Algorithm for the other side of the Family (the son’s) only has bars, no arrows. Bars are a standard mathematical symbol for scalars (quantities without direction). These measures indicate the range of the data stream’s variation and are called Deviations.
Living Algorithm’s Family of Measures - The Generations
Subscripts & Superscripts to determine Location & Generation
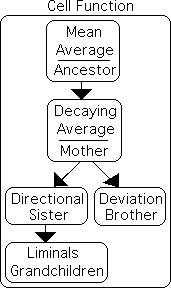
Algebraically, we note that the General Living Algorithms require superscripts (P), as well as subscripts (N). The subscript (N) determines the location in the data stream (the context). The superscript (P) determines to which Generation each central measure belongs. The Living Average (the Mother) is the Original Generation (P=0). The First Deviation and First Directional (Brother & Sister) belong to the First Generation of measures (P=1). All subsequent Deviations and Directionals (the Grandchildren, et al) belong to the latter Generations (P>1). As a group, we call them Liminals.
First Directional & Deviation: Daughter & Son in the First Generation
When the superscript is one (P=1) in the General Equations, we get the equations for the First Directional & the First Deviation, the Daughter & Son of the Living Average. Both the Creative Pulse and the Triple Pulse Graphs are visualizations of the Directional, and occur when a specific data stream is fed into the Living Algorithm System. As we've seen, these visualizations have important implications for human behavior. (We will see a picture of the Creative Pulse soon.)
General Directional
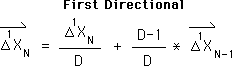
Functionally, when P=1, there’s no reason to utilize the superscript, because it is implied. Below are the simplified versions – without superscripts.
The First Directional
![]()
Living Average: Mother, the Original Generation
When the superscript is zero (P=0), the general Living Algorithm collapses into the individual Living Algorithm. This is the version of the Living Algorithm that computes the Living Average. For the same reasons stated above, the simplified version, without superscript, is shown below.
General Directional
The Living Average
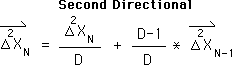
The Liminals: the Subsequent Generations
When the superscript is greater than one (P > 1), we get equations for the subsequent Generations. These are the Liminals. As an example, below is the equation for the 2nd Directional. For clarity, this is the 2nd generation of the Living Algorithm's Family, the Grandchild of the Living Average and one of the Liminals.
Mean Average: the Ancestor – no superscripts or subscripts
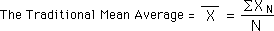
One last point. When N, the number of elements in a set, replaces D, the Decay Factor, in the general equation, the Living Algorithm collapses into a particular equation for the traditional mean average of an increasingly large data set.
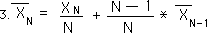
Further, if the subscripts are eliminated, the equation becomes the traditional equation for the mean average. (Check out the simple derivation in DSM.)
Universality of Living Algorithm
This reduction illustrates the universality of the general Living Algorithm. Without subscripts or superscripts, it becomes the mean average of a fixed data set – the Ancestor of the Original Generation. With subscripts it is the Living Average of a live data stream. With subscripts and superscripts, it is the one and only Living Algorithm - capable of generating a Family of powerful central measures for any data stream, live or dead. Due to this flexibility and variability of application, the Living Algorithm has incredible informational, biological, and evolutionary potentials.
Living Algorithm’s Dynamic Nature revealed through Graphic Visualization
A prior article focused upon the Living Algorithm's Instantaneous Self – the unchanging nature of her sheer Algebra. This revealed something of her nature - for instance, that she is self-reflective and regenerative. However, this snapshot of her essence (an X-ray of her inner Being) reveals little of her infinite potentials. This article is focused upon the members of the Living Algorithm Family. Again we saw an algebraic snapshot of the members, which revealed little about their dynamic character. For a more complete understanding of the Living Algorithm's mysteries, it is essential to observe her Family in action.
Living Algorithm lives to digest Data Streams
In fact, to ignore their dynamic side would be to miss their purpose for being. Neither the Living Algorithm nor her Family exists independent of context. Without a Data Stream they are nothing - like a teacher without a student. The only function of the Living Algorithm and her Family is to digest a flow of Data to provide ongoing context. Accordingly, the endeavor of the Living Algorithm is to articulate patterns. And these patterns only reveal themselves to us through observation of behavior over time. In similar fashion, physical characteristics give only a vague and inaccurate sense of what a human will do. Watching them in action is the only way to see what how they will behave. This is why recommendations and extracurricular involvement are such an essential aspect of the acceptance to college or jobs. Another example: rather than relying on a picture, a potential buyer takes a horse or a car for a ride before the purchase. "Looks great. Let's see what she can do." Similarly, we say, "Interesting equation. Let's feed her a data stream to see what she can do." In fact, the focus of the first notebook in this stream – Triple Pulse Studies – is entirely upon what happens when the Living Algorithm Family digests a data stream consisting solely of ones and zeros. Intriguing little lady - to be sure. What is the best way to study her in action?
Computer Revolution enabled Study
The Living Algorithm Family consists of many members. Each member of the Family generates an ongoing flow of averages in response to the ongoing flow of data. That is a lot of numbers - too many to comprehend without visual assistance – in fact too many to plot on a graph without the assistance of a computer. Indeed, the entire study of Information Dynamics would have been prohibitive, even impossible prior to the Computer Revolution of the late 20th century. Accordingly, graphic visualization is a great way to study the behavior of the Living Algorithm and her Family.
Dynamic Graphs reveal Family's Behavior
As the Living Algorithm Family manifests over time, their nature is best revealed through dynamic graphs, rather than static equations. As such, the current project is based primarily upon graphs. Although the graphs are generated via the numbers and equations of pure mathematics, their links with reality are revealed through their visual nature – not the numbers. This peculiar feature is linked with the context-based nature of the equations that are required to study living systems and employed to generate the models. This technique is liberating for those amiable to other means of analysis - such as inductive and intuitive reasoning. Because there are no numbers or complicated equations, only beautiful graphs, the results are accessible to all, not just the mathematical mind. The graph-like nature of the evidence enables anyone to draw their own logical inferences within the framework of the experimental results. This does not imply merely free form speculation, but enables a careful scientific examination. The visual nature of the study empowers each individual to rigorously apply the insights derived from the graphs to the circumstances of his or her own life patterns.
A Data Stream of 1s produces a Picture of Six Generations of Directionals
To clarify these concepts, both ideational and algebraic, let's examine a dynamic visual representation of some important members of the Living Algorithm's Family. A particular data stream – consisting of 120 ones – produces the idealized graph shown below. The red shaded area represents the First Directional. The other colored areas in the graph represent the subsequent Directionals (Liminals). All in all, this is a picture of the first six generations of Directionals - when the data stream only consists of ones. One function (one rule) generates the entire diversity.
Six Generations of Directionals

Creative Pulse with the Liminals
Accessible Graph vs. Dry Equation & Data
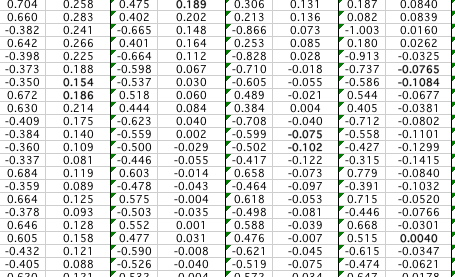
The above picture is also a visualization of the Creative Pulse with her Liminals. This graph is a key component of the Creative Pulse Project – to which she gave her name. Notice how accessible this colorful presentation is (even if we don't know what it means), especially as compared with the dry equations that define the operations or the stream of numbers that define the curves (as shown below).
General Living Algorithm
Summary & Direction
Living Algorithm's Elasticity very Pragmatic
In this article stream, we met both the Basic and General Living Algorithm along with their algebraic elements. The General Living Algorithm digests Data Streams to give birth to a Family of Measures. Only one rule describes multiple meaningful features of a data stream of numbers. This elastic feature of the General Living Algorithm's mathematical algorithm could provide exceptional utility to an organism. Expanding the Living Algorithm’s pragmatic value, her algorithm can also be applied to non-numerical entities, such as relative verbal values (as discussed in Living Algorithm Algorithm).
What is the connection between Living Algorithm Mathematics and Human Behavior?
In the article stream, Triple Pulse Studies, we saw multiple examples of how the Living Algorithm’s Creative & Triple Pulse simulate significant aspects of human behavior. What is the connection between Living Algorithm Mathematics and Human Behavior? Is their relationship based upon some confounding variable? Or is it instead based upon an integral connection between the two? Could this correspondence be based upon the dynamics of data streams? Traditional dynamics determines the power of material systems. Could data stream dynamics determine the power of data streams? Could it be that certain types of data streams are inherently more productive and efficient than others? Is it possible that evolutionary processes would naturally select this type of data stream?
Data Stream Velocity & Acceleration basis of understanding Data Stream Power
How is the power of a data stream determined? The mathematical concept of power is based upon velocity and acceleration. Velocity and acceleration are rates of change of location over time (derivatives). Thus, the first step in determining Data Stream Power is to how to compute the derivatives of data streams (their rate of change over time). With this purpose in mind, check out the next article in the stream – Data Stream Velocity & Acceleration.
For a glimpse at the Author's creative process, check out The Living Algorithm Family: Evolution of Understanding.