Introduction
The prior article delineated the Method of the Triple Pulse Experiment (an extension of the original Creative Pulse Experiment). This article is devoted to the intriguing results of the two phases of the Triple Pulse Experiment – the Rest Pulse Interruption and the Head Start.
Review: Ordered Triple Pulse contrasted with Random
The ideal Triple Pulse
Triple Pulse & Random Noise
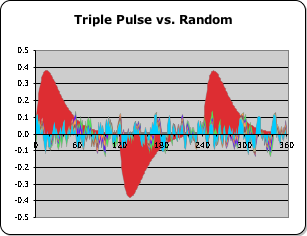
Before discussing results, let's first review the basic nature of the Triple Pulse Experiment. The highly ordered graph at right (which we deem the ideal Triple Pulse) is the result when the Living Algorithm digests a specific data stream consisting of a precise sequence of uninterrupted ones and uninterrupted zeros. This ideal sequence maximizes the peak and breadth of the resultant curve. In contrast, if the Living Algorithm is instead fed a random stream of ones and zeros, the second graph is the result. For the purposes of comparison, the ideal Triple Pulse (the red curve) remains behind the random curves (the jagged lines of the other colors). Note how different these two shapes are – one with a smooth red curve that soars high and tapers off in a gradual fashion, while the other colors appear chaotic, even tortured.
Triple Pulse: the 'ideal' standard for comparison
One last point of review: The method behind this set of computer experiments is simple. We take the uninterrupted Triple Pulse as the ideal standard and then examine what happens when we tweak the data in a variety of ways. Note: the Living Algorithm’s method of digesting data streams flows from a single unmodified equation. These 'experiments' only entail manipulations of the data; specifically, ones are substituted for zeros at different points in the sequence of the second pulse. The results of our computer experiments consist of comparing and contrasting this ‘ideal’ with 'corrupted' versions of the same graph.
Triple Pulse: Conceptual Labels
The Rest and Active Pulses
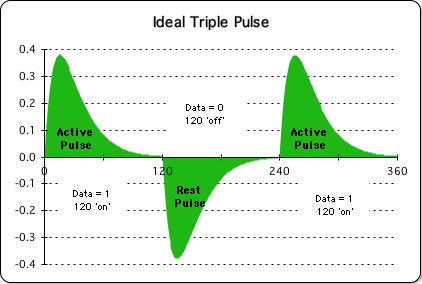
We now have a clear sense of the method that is employed to produce these intriguing graphs at the heart of the Triple Pulse Experiment. Now we are ready to explore the components of the Triple Pulse, itself. For ease of reference, let's consider the labels that we will use to discuss the three pulses of the graph. We remind the reader that the ordered sequence that produces the graph is as follows: a series of 120 consecutive ‘ones’ for the first pulse (positive), followed by 120 consecutive 'zeros' for the second pulse (negative), and then another 120 consecutive 'ones' for the third pulse (positive). As the ‘1’s suggest output and the ‘0’s suggest quietude, we will refer to the positive pulses (the 1st and 3rd) as the Active Pulses and the negative pulse (the 2nd) as the Rest Pulse.
Data Bits & 'Interruptions'
The Triple Pulse System has a strictly binary nature, as the data stream only consists of ones and zeros. As such we will refer to each member of the stream as a data bit. Further, let us consider the ‘ones’ as moments when the System is 'on', and the 'zeros' as moments when the System is 'off'. As such, we will refer to a 'one' as 1 data bit of 'on' time, and a 'zero' as 1 data bit of 'off' time. Further, when a one is substituted into the consecutive sequence of zeros, or a zero is substituted into the consecutive sequence of ones, we will refer to these data bits as 'interruptions'. Accordingly, when 5 ones are substituted into the consecutive sequence of zeros, we will refer to this as a ‘5 data bit interruption’ to the Rest Pulse.
Quotation marks indicate technical meaning for familiar terms
However, we must be cautious not to stray too far from our definitions. Despite the temporal overtones of these words, mathematically the ones and zeros in this study represent unspecified units and purely mathematical processes generate the three pulses. Familiar language, such as ‘active’, ‘rest’, or 'interruption', is introduced as an aid to understanding the results of the Triple Pulse Experiment and for ease of reference. Quotation marks will surround these words, and others like them, to indicate that they have a special definition unique to this study. As such, they represent technical constructs, rather than their typical dictionary definitions. The quotation marks will isolate these words with the hope of preventing any confusion between the purely mathematical nature of the Triple Pulse and experiential reality. In other words, the familiar terms, 'active' and 'rest’, in this study do not refer to the experiences we normally associate with activity and rest; they refer instead to strictly mathematical constructs. We will, however, omit quotation marks when employing the terms Rest Pulse and Active Pulse, since the mathematical connotation is more direct. Now, let us consider the results.
Part 1: Interruptions to the Triple Pulse's Rest Pulse
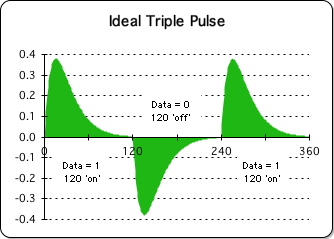
The above-mentioned alternating sequence of ones and zeros maximizes the peak and breadth of the Triple Pulse graph (shown at right). This is why we refer to it as the ideal data stream.
Interrupting the Rest Pulse
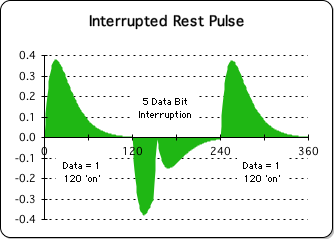
In our computer experiment, we introduced ‘interruptions’ into the second pulse – the Rest Pulse. Five consecutive ones were substituted at various locations in the data stream, resulting in the ‘interruption’ of the ideal Rest Pulse’s consecutive sequence of 120 zeros. These ‘interruptions’ were only introduced during the Rest Pulse of zeros (the 2nd pulse). The data that generates the Active Pulses of ones (the first and third pulses) remained unchanged.
Only interested in effects upon ensuing Active Pulse
Although it is only the Rest Pulse that is ‘interrupted’, we are primarily interested in effects on the final Active Pulse. The results are curious and significant. Changing the sequence of zeros in the Rest Pulse (2nd) has a striking effect upon the following Active Pulse (3rd). The sequence of ones in the Active Pulse remains unchanged, yet the peak and breadth of this final pulse is significantly reduced, apparently by the interruptions described above. Let’s examine the specifics.
5-Minute Interruptions to the Rest Pulse diminish ensuing Active Pulse
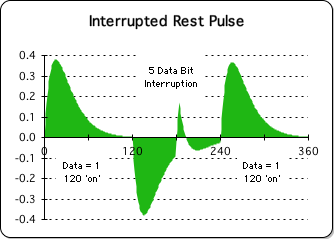
In the series of 3 graphs below, the 'five data bit interruption' comes progressively later in the cycle of the Rest Pulse. Please recall that this experiment focuses upon the effect of these interruption scenarios on the 3rd pulse – the subsequent Active Pulse. The effect on the 3rd pulse can be best understood by visual comparison with the ideal 1st pulse. The first pulse is the ideal standard for comparison, as the peak and breadth are at a maximum. Notice how the peak and breadth of the 3rd pulse shrinks in comparison with the 1st pulse when the interruptions come later in the sequence. Even though the input that generates the 3rd pulse remains the same (120 consecutive ones), the 3rd pulse is clearly affected by interruptions during the Rest Pulse.
A. Early Interruption to the Rest Pulse
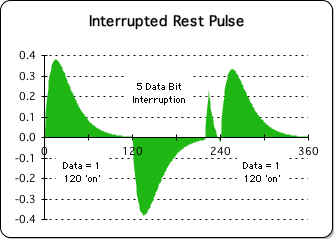
B. Middle Interruption to the Rest Pulse
C. Late Interruption to the Rest Pulse
Specifics
An early 'interruption' to the Rest Pulse had a negligible impact on the following Active Pulse (Graph A). However, as this 5-minute interruption was moved deeper into the Rest Pulse, both the peak and breadth of the subsequent Active Pulse shrank in comparison to the ideal first Active Pulse (Graph B). The final Active Pulse was smallest when the 5 data bit interruption was close to the end of the Rest Pulse (Graph C). Let's see what happens when we introduce a second 'interruption' into the Rest Pulse.
Two '5 Minute Interruptions' to the Triple Pulse's Rest Pulse
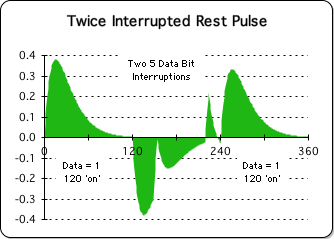
Leaving the 5 data bit ‘interruption’ of Graph C constant, we introduced a second 5 data bit ‘interruption’ at various points in the Rest Pulse. This introduction of a second interruption further diminished the peak and breadth of the next Active Pulse. Although the Rest Pulse is ‘interrupted’, the input that generates both the 1st and 3rd Active Pulses still remains the same (the ideal data stream of 120 consecutive ones). However, when the 3rd Active Pulse follows a twice-interrupted Rest Pulse its potentials are severely hampered.
D. Twice Interrupted Rest Pulse: Early
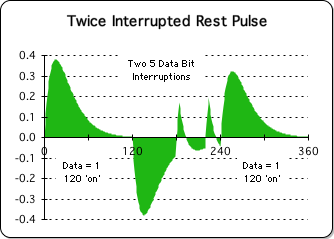
E. Twice Interrupted Rest Pulse: Middle
F. Twice Interrupted Rest Pulse: Late

Description of Effects of Double Interruptions
Similar to the single interruption experiment, an early second 'interruption' to the Rest Pulse also had a negligible impact on the subsequent Active Pulse (Graph D). As this second 5-minute interruption was moved deeper into the Rest Pulse, both the peak and breadth of the subsequent Active Pulse shrank in comparison to the first Active Pulse (the ideal pulse). Both Graphs E and F demonstrate this progressively significant effect.
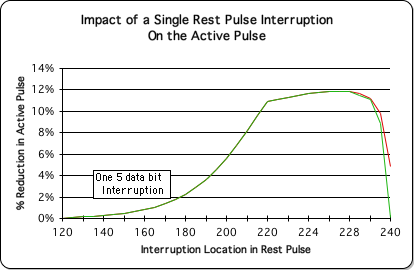
Graph: Percentage Impact of Single Interruption upon Peak and Area of final Active Pulse
Graph G below illustrates a different way of visualizing the impact of a single interruption. The percentages on the left of the graph (the vertical y-axis) represent how much the area and peak of the final Active Pulse is diminished in comparison to the initial Active Pulse. The numbers on the horizontal line (the x-axis) represent the location along the 120 data bit Rest Pulse where the 5 data bit 'interruption' occurred. The negative impact of these 5 data bit 'interruptions' upon the peak and the area of the following Active Pulse begins at no impact (0%), gradually rises to a 10% reduction, then reaches a plateau before falling off sharply at the end of the Rest Pulse.
G. Percentage that 3rd Pulse's Peak and Area Shrinks with a Single Interruption
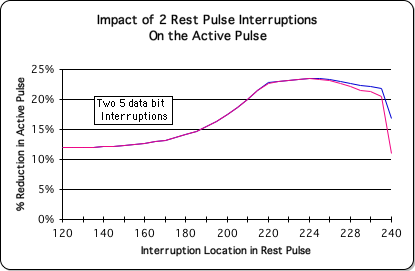
Graph: Percentage Impact of Double Interruption upon Peak and Area of final Active Pulse
Graph H builds upon the results of Graph G by examining the effects of a second 5-minute interruption. The percentage reduction in the peak and area of the final Active Pulse begins at about 12% (the maximum effect of a single interruption noted in Graph C). It then rises to over 20% before falling off near the end of the pulse in a manner similar to the effects of a single interruption. Clearly, the second interruption intensifies the negative effects to the ideal pulse. Further, the deeper into the Rest Pulse that the interruptions occur, the greater the impact.
H. Percentage that 3rd Pulse's Peak and Area Shrinks with a Double Interruption
Triple Pulse Experiment indicates relationship between Pulses
The nature of the Triple Pulse reveals a surprising mathematical relationship that was not observable when limited to a study of a single pulse. The original Creative Pulse Experiment was limited to the effects on the single 120 data bit pulse (the Pulse of Attention) that contained the 'interruption(s)'. In contrast, the Triple Pulse Experiment focuses upon the possible relationship between pulses. We found that 'interruptions' to the Rest Pulse consistently had an impact on the following Active Pulse. This mathematical certainty articulates an inescapable relationship between the two pulses. Interruptions during the 2nd pulse significantly reduce the dimensions of the 3rd Pulse, even when this Active Pulse consists of a series of 120 uninterrupted ones. There is no way to avoid this relationship between consecutive pulses. This is a clear-cut example of how past events affect future potentials in the Living Algorithm System.
Part 2: The Head Start Experiment
Head Start History
In 2002, the Experimenter noticed that the Triple Pulse mathematical model could have relevance to experiential reality. This first set of experiments seemed to be consistent with his personal experience with sleep interruptions. When his children were small, the frequent middle-of-the-night interruptions to his own sleep cycle seemed to consistently impair his mental abilities during the following day. Reflecting upon the connection between his mathematical modeling of the effect of interruptions and his own experiences, the experimenter began to wonder what other applications the Triple Pulse might have regarding the Sleep/Wake cycle. He decided to investigate what this model suggested about the common strategy of waking up earlier to get a head start on the day. The Head Start Experiment was the result of this line of inquiry.
Head Start Method
In the prior experiment we noted a distinct relationship between successive pulses. Will this intimate association continue to apply? For instance, what happens when the subsequent Active Pulse encroaches upon the Rest Pulse? In other words, what happens when the data stream for the Rest Pulse is shortened and the data stream for the ensuing Active Pulse is lengthened accordingly?
The specific method the experimenter chose for this line of inquiry is as follows. The experimenter prematurely turns ‘on’ the final Active Pulse’s string of ones at various points during the Rest Pulse. In other words, the final Active Pulse’s string of ones begins earlier, at the expense of the preceding Rest Pulse’s string of zeros. He felt that this mathematical experiment effectively simulated the strategy of waking early to get a jump on the day – hence the name, the Head Start Experiment.
Head Start Results
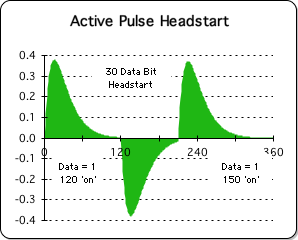
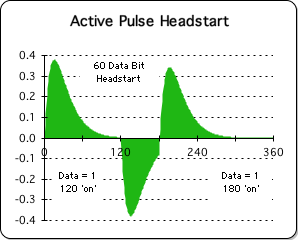
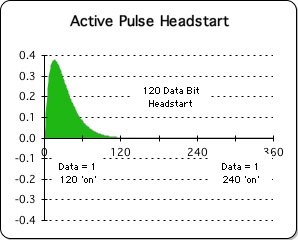
In this experiment a series of graphs investigate a range of ‘head starts’. In Graph G, for instance, the data stream for the Rest Pulse of zeros is shortened by 20 data bits. These same 20 data bits are added to the ensuing Active Pulse’s string of ones. Graph G, therefore, shows a short 'head start'. In the successive pictures, the Active Pulse’s 'head start' increases gradually – further shortening the Rest Pulse. In the final graph in the sequence (Graph J), the Active Pulse completely absorbs the preceding Rest Pulse.
G. Short Headstart
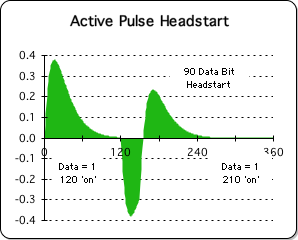
I. Long Headstart
H. Medium Headstart
J. Complete Headstart
As Head Start increases, final Active Pulse's Dimensions decrease
What are the inescapable mathematical conclusions? It is obvious that this head start is devastating for the final Active Pulse (the 3rd Pulse). The more that the Active Pulse encroaches upon the preceding Rest Pulse, the more its own dimensions shrink as well - until it disappears altogether. The 'ambitious behavior' of the Active Pulse, which was designed to increase ‘productivity’ by increasing ‘active’ time, ironically achieves the opposite effect. This counter-productive behavior is exhibited in the graph below.
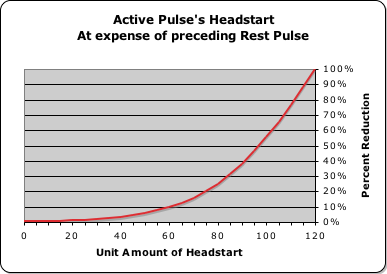
As the graph moves to the right, the ‘head start’ increases. And as this ‘head start’ increases, the dimensions of the Active Pulse decrease proportionately, as indicated by the rising line. When there is no ‘head start’, the dimensions of the Active Pulse’ are ideal. The Active Pulse maintains 100% of its original ideal Triple Pulse value, which is represented on the far left of this particular graph by 0% reduction of value. When the 'head start' completely absorbs the Rest Pulse, both pulses experience a 100% reduction of their original value – as shown on the far right of the graph. Both pulses suffer equally from the intrusion upon the ‘rest’ cycle. This certainly appears to be a lose-lose situation.
Summary
This article delineated the results of the Triple Pulse Experiment – an extension of the original Creative Pulse Experiment. Let's summarize our findings.
The Living Algorithm digests a specific data stream to generate the ideal Triple Pulse. This data stream consists of a string of 120 ones followed by a string of 120 zeros, which in turn is followed by another string of 120 ones. As the name suggests the Triple Pulse graph consists of 3 alternating pulses – the 1st, an Active Pulse; the 2nd, a Rest Pulse, and the 3rd, another Active Pulse.
Part 1 of the Triple Pulse experiment consisted of introducing ‘interruptions’ (a string of 5 ‘ones’) at a variety of locations during the Rest Pulse (the string of 120 ‘zeros’). Employing the ideal Triple Pulse as a ‘control’, it was evident that interruptions to the Rest Pulse significantly reduced the dimensions (both the peak and area) of the ensuing Active Pulse. This Triple Pulse computer experiment clearly showed an undeniable mathematical relationship between the Active and Rest Pulses.
Part 2 of the Triple Pulse experiment continued the investigation of the relationship between pulses. We gave the final Active Pulse a 'head start'. This meant that it began its cycle of ones before the preceding Rest Pulse of zeros had ended. These scenarios showed that the peak and breadth of the ensuing Active Pulse shrank as its intrusion upon the natural cycle of the Rest Pulse increased. It was clearly evident that the ‘head start’, which occurred at the expense of the preceding Rest Pulse, had a negative impact on the following Active Pulse.
Questions & Links
This article explored the intriguing results of the two phases of the Triple Pulse Experiment – 1) Interruptions to the Rest Pulse and 2) the Head Start Experiment. Do these results have anything to do with human behavior? If so, is there any experimental verification for these correspondences between a purely mathematical construct and day-to-day existence? If there is scientific evidence for this linkage, what sort of causal mechanism might be inferred? To begin to answer these questions, check out the next article in the series – Triple Pulse & Sleep Deprivation.
Or if you ready for more emotional content, shift into our parallel universe and read Life fascinated by Interaction between Pulses.