Home Science Page Data Stream Momentum Directionals Root Beings The Experiment
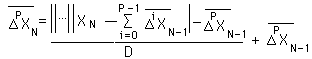
In this first scenario we will begin with the Continuous Data Stream. It begins with a stream of zeros. All the deviations prior to the first non-zero Data Point, X0, equal zero. Below is the general equation for Deviations.
When N = 0, we get the following equation.
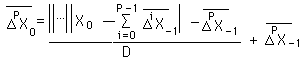
Because of the negative subscripts, all the terms = 0 except X0 and D. Remember X0 is the first non-zero Data Point. Hence all the initial non-zero Deviations = |X0/D|.

Let it be restated that this is only true when X0 is the first non-zero Data point. Although X0 can be positive or negative, each initial deviation can only be positive. For this study we will confine our attention to the situation when all the Data Points, XN, are greater than or equal to 0. Remembering that our Data is positive, we will dispense with the absolute value signs in the discussion that follows.
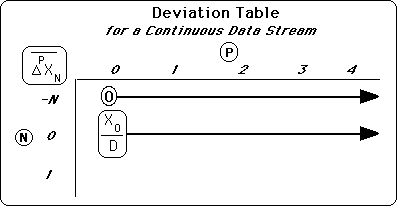
Let us build a table for the deviations of our continuous Data Stream. The results are listed below, simple & straightforward, belying the complexity to follow.
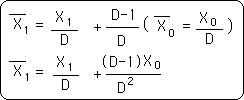
Above is the derivation of the Decaying Average of the first, not the initial, Data Point.
Whenever an equality is enclosed in parenthesis inside an equation; it refers to a previously proved identity.
Below is the derivation of the first deviation after the first Data Point. Because of the absolute value signs there are three solutions to this problem. So simple before, getting complex already.
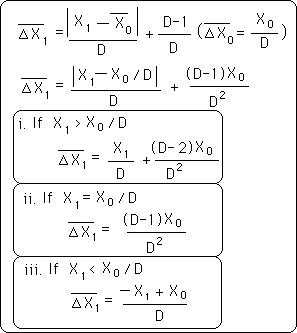
From Simplicity to Complexity in the blink of an eye.
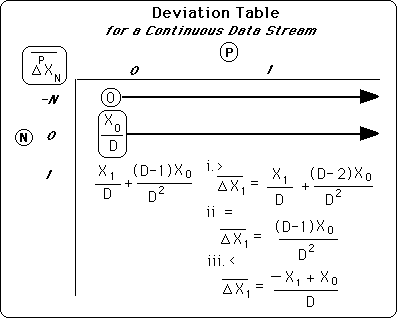
Below is our upgraded Deviation Table. The deviations of negative points all = 0. All the Deviations of the initial point, X0, equal X0/D. This is simplicity. The decaying average, the zeroth deviation, of the first point, X1, has one complicated solution. The 1st deviation of the first point has three complicated conditional solutions, derived above. Instant Complexity. Let us take another tack.
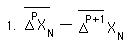
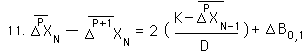
Before going on let us look at the general difference of consecutive deviations, expressed symbolically below. When the difference is positive the lower deviation is greater; when the difference is negative the higher deviation is greater; when the difference equals zero, the two deviations are equal.
Returning to the general definition for the Pth Deviation.
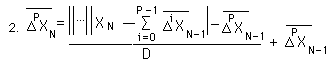
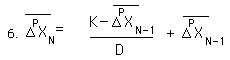
Applying this formula to the next deviation, we get the following equation.
Another way of expressing this equation is:
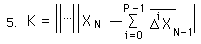
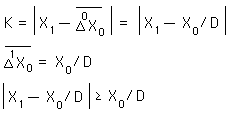
Now let a constant, K, equal the first term.
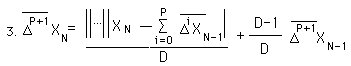
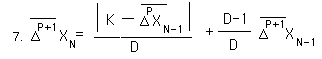
Now the equation for the Pth deviation is:
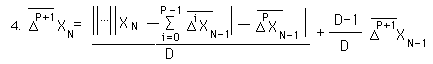
The equation for the P+1 deviation is:
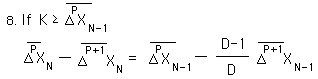
Let us now compare these equations. We will call the first term after the equality sign the A term. We will call the second term, the B term. In the A term, when K is greater than or equal to the second half of the expression, the two A terms are equal and the B terms totally determine which deviation is greater. Symbolically:
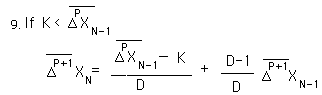
If K is less than the second part of the expression then the difference reverses itself in equation 7. This follows.
Now our difference becomes the following with Bs replacing the appropriate terms, for economy of expression.
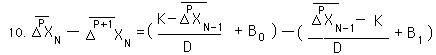
Simplifying and substituting a delta term for the difference of the B terms, we get the following expression.
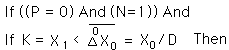
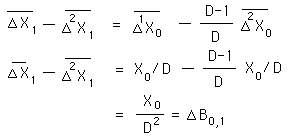
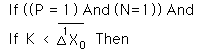
Now that we have some general equations we are ready for some specific examples. Let us start at the beginning and build up. Let us begin with the condition when P=0 and N=1. We also apply Equation #5 to determine K's value.
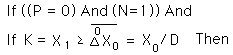
Applying Equation #8
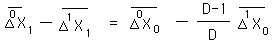
Entering known values and simplifying
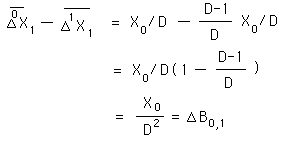
The preceding derivation shows that the zeroth deviation is always greater than the first deviation on the first point, when the first point is greater than or equal to the initial point divided by D, the Decay Factor.
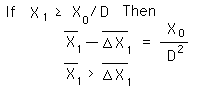
This is a restatement of the above derivation in more familiar terms. If the first Data Point is greater than the initial point divided by D, then the Decaying Average is greater than the First Deviation at the first point by an amount of the initial Data point divided by the square of the Decay Factor.
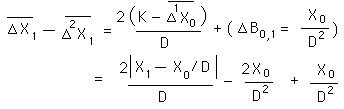
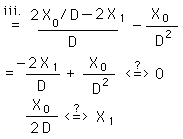
Using the same logic as above when in the less than condition:
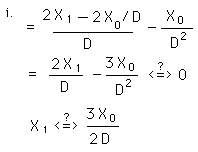
Applying Equation #11, known facts, and simplifying
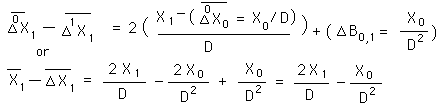
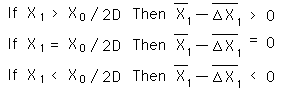
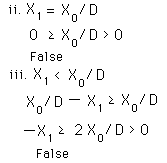
Determining when the difference is positive, negative or zero determines whether the deviations are greater than, less than, or equal to each other.
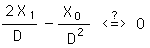
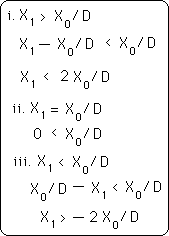
Looking at X1 as a function of X0.
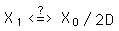
These are the three conditions.
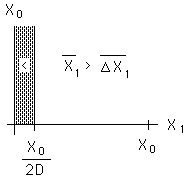
This is the graph.
Let us move to the comparison of the first and second deviation after the first data point. The first line below establishes the general parameters. The second line establishes the first condition.
Employing equation #8, substituting known values and simplifying, we get:
The same result as before!? As a matter of fact, the difference between each of the consecutive deviations for this first point is exactly the same under this condition. Each of the initial deviations is equal. Hence the difference between each of the first deviations is also equal on this first point only.
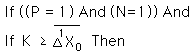
Now let us look at the K inequality, which defines this condition. Last time it was easy; K was a fixed value. Now K is the absolute value of a difference. Horrors! 3 conditions. Using equation #5, we get the first equation below. The last equation is the restatement of the K inequality with the appropriate values plugged in.
With the absolute value sign we have three possibilities or conditions. The first greater than condition is shown on the first line. The implications for the above equation are shown on the second line. The simplification on the last line.

Below are the second two conditions, the equal to and less than. Both lead to impossible results: the second because nothing can't be less than something, the third because something negative cannot be greater than something positive.
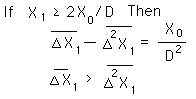
This leads to the following conclusion. When the first point is greater than or equal to the initial point doubled then divided by D, then the first deviation is always greater than the second deviation by the specified amount.
Below is the second logical condition.
We apply Equation #11 and substitute for the known values.
Below are the three K conditions and their implications, when the K inequality is in the less than position.
Under the first K condition our difference of deviations gives the following result. If the difference is positive then the first deviation is larger than the second. So if X1 is greater than 3/2 the initial data divided by D then the first deviation is larger. Similarly if they are equal then the deviations are equal and if X1 is smaller then the first deviation is smaller than the second.
Under the second K condition, equality, our difference of deviations gives the following result. Stated verbally: When X1 equals X0/D then the second deviation is always larger than the first by that same enigmatic amount.

Under the third K condition, less than, the difference of deviations leads to the following results. When the difference is positive then the first deviation is larger than the second. Hence if X0/2D > X1, then the difference is positive. When X0/2D < X1, then the difference is negative. Conversely when X1 > X0/2D, the difference of deviations is negative; hence the second is greater than the first deviation. Similarly if the two terms are equal then the deviations are equal.
The X0/2D is the dividing line between the > and < conditions.
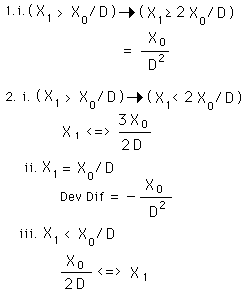
Below are the summary of the results from the first condition of the K inequality, and the second condition of the K inequality with the three sub-conditions.
Below is the graphic representation of the different possibilities. The vertical axis represents the difference between the first and second deviations on the first point. The horizontal axis represents the values that X1 takes as a function of X0, the initial point.
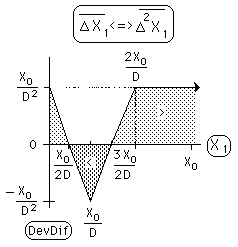
The graph reaches a low point when X1 = X0/D. However there is only a very limited range when the second deviation is greater than the first. It is low but not too low. When X1=0, it rises right back to its maximum positive value. So just stopping does not make the second deviation > the first deviation