Home Science Page Data Stream Momentum Directionals Root Beings The Experiment
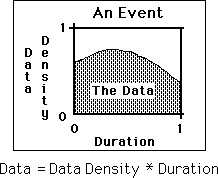
In order to reinforce distinctions, we will return to a brief reprise on data accumulation. Random Data has one dimension. It is only a number, unrelated to a Source. Random Averages have variable Durations that the averages are accumulated over. When the Duration is one, then it is the Random Data Stream. Real Data, Live or Dead, has two dimensions. Many people consider Data in any form, just a number. However, as was pointed out in the first part, time related data has two elements. First there is a Duration, the basic unit of data accumulation. Second there is the Data Density, the percent that the Source participated in the Activity during the Duration. The Data is simply the product of the Data Density, or % of Participation in the Activity, and the Duration. The Data quantifies the Event associated with the Duration. Below is a geometric representation of an Event with its two parameters. The vertical axis represents the Data Density. The horizontal axis is the Duration. The shaded area is the Data, the number that would be thrown into the Data box for that Duration.
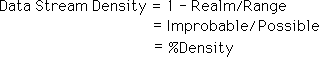
Data Stream Density refers to three dimensions because Time has been added. Time is included in the Deviations of the Realm. A more appropriate name for Data Stream Density would be Percent Improbability because it is merely a ratio of Improbable to Possible. For clarity, however, we will refer to it as Percent Data Stream Density, %Density, in the following definitional Derivation, even though the density is what is not a percent of the whole rather than what is.
Remember that Data Stream Momentum is the product of Data Stream Density and the Average. For familiarity of concept, we chose the word, momentum, from physics. In order to avoid brain puns, we will now shift to the word, Flow. The Dead world of predictable things and the Live world of spontaneous beings have many similarities and analogs but at heart are different systems. To avoid mixing them up we will call Data Stream Momentum, Data Stream Flow, from now on.

The conservation of momentum is a physical property of matter. However Flow is not conserved in the animate system. Although we're not going to get into it now, the more Turbulence a system has, the less Flow it has. As the Turbulence of a Live system increases, the Flow decreases. As the Order of a Live system increases, the Flow increases. Eventually we will define Turbulence and Order in terms of Flow. It is easy to see that the concept of Flow carries a lot of information that is quite different in nature from physical momentum although at heart they are the same concept applied to orthogonal systems.
We will now define the percent of total Flow as the ratio of Flow and Duration. Each individual Flow is a part of the total Duration. Hence it is a percentage of the whole. Substituting for Flow, we find that the percentage Flow is the product of two ratios. One is the Data Stream Density ratio, Improbable to Possible, and the other is the ratio of the Part to the Whole, the Average to the Duration.
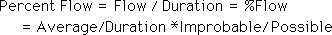
The second ratio is similar to the Data Density, or percent participation, of the individual Data in the Duration. This is the Percent Participation of the collective Data, i.e. Average, in the Duration. We will call it the percent of the Total.

The percent of the Flow of each Data Stream is the product of two percentages, the percent of the Total and the percent of the Data Density.

Density in these live studies will refer to a percentage measure, which is a ratio of a Part to the Whole. The percent Density is the Data Stream Density. The percent Total is the Average Density. The percent Flow is the Flow Density. These terms will be used interchangeably depending upon which aspect of the measure we're trying to stress.
If all the Averages of all the Data Streams making up the Duration, including the Null Data Stream, are added up, they equal the Duration. This is true by definition, because the Null Data Stream is the difference between the Duration and the sum of all the known Data Streams making up the Totality. The Totality is the entire phenomenon. Thus if all the Average Densities are added up, they equal 1 or 100%. However the sum of all %Flows does not necessarily equal one. As a matter of fact, if the sum of all the Percentage Flows of a Live System approaches one, then it is approaching Death. If the sum of all the percentage Flows approaches zero then the System approaches Random. This is because the Data Stream Density is a measure of dissipation and order of the individual Data Streams that make up the whole.
Before going too much further, we would like to point out that we have started referring to the Average and Deviation in much more general terms. We developed the concepts of Data Streams around the Mean Average and the Standard Deviation of a growing Set because these are familiar concepts. However these same ideas would also apply to a more general concept of Average that would encompass other definitions of the Center of the Set or Stream. Also while the Standard Deviation is the Deviation of choice for many scientists, there are other measures of Average Deviation, which are equally applicable. The only necessity for a Deviation is that it defines a Realm of Probability. Remember in the discussions that precede and follow that the term Average refers to any measure, which refers to the center of the Stream, and that the term Deviation refers to any measure of Change around the central axis of the Average.
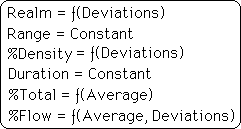
Below is a breakdown of the variables and constants making up the Percent Data Flow. We see that the Range of Possibility and the Duration are constants. The Realm is a function of Deviations while the % of the total is a function of the Average. Hence the percentage of the flow is a function of Averages and Deviations. Of course, these are functions of the data.
As the number of data bytes becomes greater, the stability of these central tendencies also becomes greater because the potential impact of each subsequent piece of data becomes smaller. As the stability of the mean average and the Standard Deviation becomes greater, so do the measures based upon them. This includes the Realm, the Data Stream Density, and the Flow Density, i.e. %Flow. But do we want these measures to grow increasingly stable? If the measures of these Living Data Streams become increasingly static, what's the point of the study?
In the analysis of Flows, we see that each Phenomenon can be characterized by its Flow patterns. {The larger N grows the more stable these Flow Patterns become. This problem will be dealt with in the Notebook, Decaying Averages. For now we will assume that our Data Flows, the momentum, is sensitive to change.} When the Flow patterns change, so does our phenomenon. When the amount of Flow changes, so does our subject. The following section deals with Data Stream change and more specifically Flow change. The change in Flow is the change in Flow over time. Therefore because Flow is a momentum, and the change in momentum over time is force, we will call the next section, Data Stream Force.