How & When does Info Energy spark the Gap?
HW Seattle: 3-30-2012, Friday, 1.5 hr, Trans 4-4-12
There is an obvious gap between Mind and Body. We think and make decisions in a mental world, yet we act in a material world. Descartes claimed that these two worlds are separate and distinct. His notion that the there is no bridge between thought and matter has accumulated in importance to the scientific community ever since he first proposed the idea. In fact many, if not most, scientists now (nearly 400 years later) make the logical inference that thinking is a function of matter. In other words, thought arises for purely material reasons. Because they have determined the automatic and absolute behavior of atoms and molecules, a significant subset of these scientists believe we are on verge of, or at least have the capability for, formulating absolute laws that will determine human behavior as well. Many of the remainder of this esteemed and well-educated international collective of the brightest minds on the planet spend their entire careers earning fame and fortune studying the material roots of thought. It is supposed that even though we may never have a complete explanation that the answers to human behavior still lie in the material world.
In contrast, the thrust of the mathematical study of Information Dynamics is to show how Mind and Body are linked through the digestion of Information. The intent of this particular article is to illustrate how and when the Info Energy of the Data Stream sparks the Gap between Mind and Body. We are going to attempt to explain this process by examining an old question with our current insights in mind.
Continuous Approach ends higher than Core Concept. What is significance?
In the prior article, we explored the dual nature of mass as both inertia and substance in the dynamics of information. With this understanding, we can now propose a solution to a question that emerged from a prior mathematical study – Core Concept vs. Continuous Approach.
Dr. Medina employs Core Concept Approach to work within constraints of 10-minute rule.
To refresh the memory, let's briefly summarize the study. Experimental results have indicated time and again that the listener's attention fades after just 10 minutes in a lecture situation. The results have been so conclusive that cognitive scientists have deemed this the 10-minute rule. In other words, the Continuous Approach to teaching, where information is presented in an undifferentiated flow for a full hour, is an inefficient method of transmitting information. To work with the 10-minute rule, Dr. Medina employed what he called the Core Concept Approach to lecturing. In this approach, the presented information centers upon a core concept for 10 minutes before shifting to another core concept for the next 10 minutes. As evidence of the effectiveness of this instructional technique, Dr. Medina has won many awards for teaching.
Mathematical study: Core Concept Approach effective because all data stream derivatives are active
Our mathematical study contrasts these 2 approaches to lecturing: the Core Concept and the Continuous Approach. To this end, the Author generated 2 mathematical models via the Living Algorithm that simulated these approaches. He, then, examined what the mathematical models have to suggest about the underlying nature of these instructional techniques. For purposes of comparison, each model employs an identical amount of info energy over an identical amount of time. The mathematical results were quite clear. All of the data stream derivatives, the rates of change, are active during the Core Concept Approach, while only one of the higher derivatives is active during the Continuous Approach. The mathematical results of this comparison suggest that the Core Concept Approach is more effective than the Continuous Approach because more derivatives are engaged. The Author presented evidence that the higher derivatives, the Liminals, are associated with the subconscious digestion of information. Without Liminal activity, the Continuous Approach although conscious, is unable to assimilate new information. For this reason it was deemed the ‘Lights on; Nobody Home’ Phenomenon.
A Contradictory Mathematical Fact
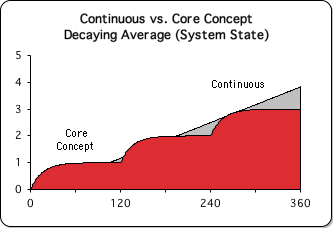
However, a nagging mathematical fact remained. The Living Average of the mathematical model for the Continuous Approach rises to 4 mathematical units. By comparison, the Living Average of the Core Concept model rises to 3. (See graph.) In fact, it is visually apparent that the Continuous Approach moves increasingly ahead with each step of the Core Concept. If we take the Living Average (the state of its system) to indicate how much information is transmitted, then these results seems to indicate that the Continuous Approach is able to impart more information (33% in this case) than the Core Concept Approach. What is the significance of this finding? If the Core-Concept Approach were truly a more effective teaching method, then it would seem that the state of its system would end higher. Does this indicate that the Continuous Approach might be more successful than the Core-Concept Approach at transmitting a bulk of information, at least in certain circumstances? Answering this question is the thrust of this article.
Data Stream Density => Concentrated Energy
Einstein: Matter is Energy that is stored in system
To answer this question we must look to Einstein for assistance. His famous equation – E = mc2 – states simply that energy and mass are not distinct entities, but are instead transformations of each other. Accordingly, the mass of a system represents how much energy is in the system. In the material world the conversion factor from matter to energy is very high – the speed of light squared (c2). The enormous size of this factor in the conversion of mass into energy is why nuclear energy is such an appealing concept for war or peace. The forces binding microscopic hydrogen atoms together can be converted into usable energy. Unfortunately, the conversion method is fraught with difficulties, for instance radioactive waste.
Inertia of Information Flow = Data Stream Density
Let’s apply this principle to the Living Algorithm System. Mass in the Newtonian system is the measure of an object’s inertia (its resistance to a change in velocity). In the Data Stream Momentum notebook, we developed a similar measure to represent the inertial component of the data stream. We call it Data Stream Density.
Interaction of Substance of Matter & Info creates Reality
As a brief review, mass has two components, inertia and substance.

In the material world the two components of mass are joined as one. In the Living Algorithm’s Info System, the two components are separate.

Data Stream Density is the inertial component of information flow, while Attention imparts substance to the flow of information.
![]()
The substantial component makes the world real for living systems. The interaction of Attention and Matter determines the nature of Reality for organisms. Each is necessary. Without either of these components, living reality unravels.
![]()
![]()
Inertia of Mass = Energy to Change Reality
While substance imparts reality, the inertial component of mass determines the amount of Energy that is stored in the System, whether the system is material or informational in nature.

In other words, the inertial component of mass defines the relationship between Reality (the Info/Material System) and Energy. This is of equal importance because Energy can change Reality. Remember an essential and unique feature of Energy is its ability to change the State of the System. So the inertial component of mass, while not granting Reality, illustrates how to change Reality. This transformation occurs via Energy, whether matter or information based.
![]()
![]()
Data Stream Density: Random vs. Organized
To see how this process enables the Energy of Information to transform Reality, let’s briefly examine the Equation for the Density of a Data Stream. Bear with me; this might be a bit difficult for those who are challenged by abstraction.
Equation for Data Stream Density
In the Data Stream Momentum Notebook of 1994, the Author derived an equation to represent the density of a data stream (the inertial component). Below is the current version of his original equation. (For a discussion of the differences between the 2 equations, check out the derivation.)

In the above equation, 'Range' refers to the possible range of the data stream. A 'Deviation' is the range of variation of the data stream. The Living Algorithm digests the data stream to produce the Deviation.
What does this equation mean? Let's look at a picture of the range of results to clarify meaning.
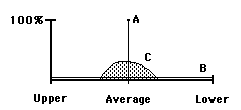
• Line A represents 100% Data Stream Density. All the possibility is concentrated into one point. The Deviation (the range of variation) is very small – approaching zero. The numerator of our Density Equation becomes zero and the equation reduces to one. Because the Density is high the Energy of the Data Stream is very concentrated and has the possibility of changing the state of the system.
• Line B represents 0% Data Stream Density because any possibility is just as probable. This occurs when the Deviation is very large – approaching the size of the Range of Possibility. The Numerator equals the Denominator and the equation reduces to zero. Because the Density is low, the Energy of the Data Stream is very diffuse, with very little possibility of changing the system.
• Area C is a mix of the two.
Organized Data Stream (Meaning) has high Density and Energy
Let's look at some examples. As the Deviation of the data stream gets smaller, the Density of the data stream approaches 100%. Deviation down; Density up. This is true of highly concentrated data streams. For example, the data stream representing the blue sky is quite substantial because it is a steady stream of a specific electromagnetic vibration. The blue data stream's range of variation (the Deviation) is very small. Another example: the Density of a car's location becomes larger and larger as the car approaches and grows smaller and smaller as the car fades into the distance. As the Density of a data stream approaches 100%, it has more and more substantiality, as in the data streams of the blue sky or the approaching car. As the Density approaches 100%, the Energy of the Data Stream becomes concentrated enough, presumably, to do the Work of changing the State of the System. This might manifest as the sensory perception of blue. Or if the car is headed at directly at you, you might want to change your position.
Random Data Stream (Noise) has low Density and little Energy
In contrast, because the Deviation of a random number stream (or noise) is high relative to the Range, the Density of a random number stream is very low. Deviation up; Density down. Because the Density is low, the random number stream has very little Energy to change the System. As the Density of the data stream approaches 0%, it has less and less substantiality. This is as it should be.
Comparison: Random Data Stream vs. Organized Triple Pulse
Let's compare what happens when the Living Algorithm digests a random data stream and the highly organized Triple Pulse sequence. Both data streams are of equal length (360) and consist solely of 1s and 0s. We employed the Excel random function to generate the random data stream. This method restricted the data stream to a string of 1s and 0s. This process is identical to flipping a coin and registering a head or tail. The Range of both streams is 1. Let's check out the difference between the Deviations (the range of variation) of each stream. Remember the ratio of the Deviation to the Range determines the crucial Data Stream Density.
Graph: Deviation & Range – Random vs. Triple Pulse
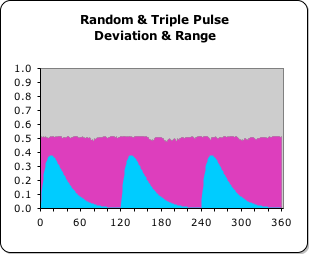
At right is a visualization of the Deviations of each data stream as compared with their common Range (1.0). The blue curved area is the Deviation of the Triple Pulse. Notice how it rises and falls with each pulse. The ragged purple area is the Deviation of a Random data stream. Note that the Triple Pulse peaks (≈.35) are significantly smaller (≈30%) than the relatively flat line (≈.50) of the Random Stream's Deviation.
Density of Random Data Streams = 0%
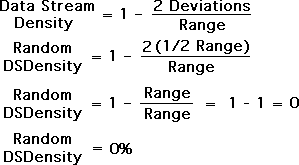
This visualization applies to any random data stream that is generated – not just the one we chose. Although each data point is entirely unpredictable (either 1 or 0), the Deviation of any random data stream is boringly stable. In general it is half of the Range. Accordingly, when the Deviation is doubled, it equals the Range and their ratio is one. When the ratio is 1, the Density is 0%. Hence the Density of any Random Data Stream is 0%. Random Data Streams are totally insubstantial and without any concentrated energy. This accords with common sense.
Utility of Density Ratio provides Method to differentiate Noise from Meaning
The simple ratio (Deviation/Range) that determines Density also provides an easy method to differentiate a random signal from an organized signal (data stream). The higher the Density of the data stream, the less likely it is to be random noise. Density up; Random down. Conversely, the lower the Density, the more likely that the data stream is random. Density down; Random up. The ability to differentiate random noise from potential meaning is the first essential step towards the crucial capacity for pattern recognition.
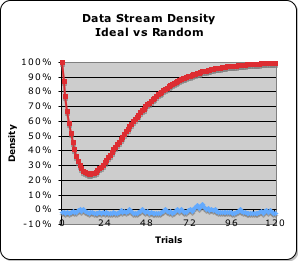
Graph: Data Stream Density – Ideal Pulse vs. Random
The graph at right indicates these relationships. The red line visualizes the Energy Density of the data stream that generates the Ideal Pulse (a data stream consisting solely of 1s). The blue line visualizes the Energy Density of a Random Data Stream (a random assortment of 1s and 0s). After falling precipitously to just above 20% energy density, the highly organized Ideal Pulse (red) soars to completion (100%). In contrast, the energy density of the Random Data Stream hovers around 0%, never rising to even 5%. It is visually apparent that attunement to the energy density of a data stream could enable an organism to differentiate random and organized data streams.
Evolutionary Examples of the Density Filter
If biological systems employ the Living Algorithm to digest data streams, as we theorize, then it seems reasonable to make the prediction that organisms would evolve to utilize the Density Ratio as a filter for differentiating noise from meaning. There are multiple indications that affirm this prediction.
Could the Eyes, as a motion detector, employ the Density Filter to identify Significant Data Streams?
Perhaps the most fundamental use of the eyes is as a motion-detector. The frog’s eye detects the motion of a fly, and the tongue darts out to procure food. The sheep sees some kind of organized activity and runs. The eyes of both the predator and the prey have a wide range of vision. To limit this unwieldy range, the sensory organism must employ some type of filter to differentiate a meaningful signal from a random signal. The eyes’ sophisticated neural networks could easily compute the Density Ratio, an ongoing ratio of data stream density to data stream range, to quickly determine whether the data stream was worth focusing Attention upon or not. The eyes would only direct a consistent mental focus to a data stream, whose Density remained consistently high. It is certainly plausible that the sensory apparatus of the eye might employ the Living Algorithm’s Density Ratio to differentiate a random from an organized signal.
Could Prey have evolved to move erratically, to reduce Data Stream Density and avoid Detection?
In the evolutionary arms race, the prey needed a means to avoid the eye’s motion detector. We theorize that the eye employs the Density Ratio as a means for detecting significant motion. If this is so, then moving in a manner that lowered this ratio would be successful behavior, as this type of motion would be interpreted as random, and hence ignored by the prey’s eyes. Consistent motion raises the Density, while erratic motion lowers the Density. Lowering the Data Stream Density lowers the chance of detection and raises the chances of survival. It seems reasonable to assume that if prey moved erratically to avoid detection, they would increase their chances of survival, and those that moved with regularity would perish. Under this scenario, certain hunted species would evolve over the course of time via natural selection to move erratically, in an almost random fashion, to circumvent the Density Filter. Is there any evidence of this strategy in nature?
Many examples of seemingly random motion: bugs, rodents, and birds
We see many examples of this behavior in the animal world. Many creatures have evolved to move randomly, in such a way that the Density of their data stream approaches zero. Insects and smaller organisms seem to employ this technique to reduce their substantiality and thereby avoid detection by the predator. Instead of moving continuously, prey, whether birds, rodents, fish, or insects, dart about erratically – stopping and starting suddenly without a visible pattern. Besides making it harder to predict their next position, it also makes it harder to detect their very existence. This inability to detect existence would be especially true for predators that rely primarily on motion detection to capture their prey. In the science fiction novel Dune, humans were required to move in a random fashion to avoid detection by the giant worms. It could even be argued that the ability to see color and stationary objects was an ability that predators developed to counter this defensive ploy in the evolutionary arms race with their prey.
Data Stream Density: Continuous Approach vs. Core-Concept
While interesting, the Density Filter is not the feature of Data Stream Density that is our primary concern. Data Stream Density as Data Stream Mass is what interests us here. We theorize that the inertial component of mass (the Density) also determines the energy of the data stream – its capacity for changing the System. How do these notions concerning the Energy Density of a data stream apply to the Continuous versus the Core-Concept approaches to presentations?
Continuous Approach to Teaching: State high, Energy Density low
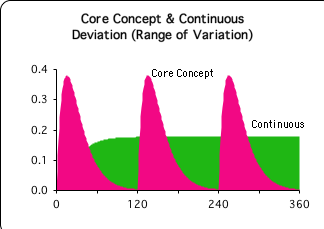
The graph at right compares the Deviations of the Continuous and Core-Concept Approaches to presentations. The Deviation of the Continuous Approach (the green background sector) rises to about 0.2 and then remains there for the duration. In contrast, the Deviation of the Core-Concept approach (the three magenta pulses) rises twice as high (to about 0.4) and then falls to 0 in each pulse.
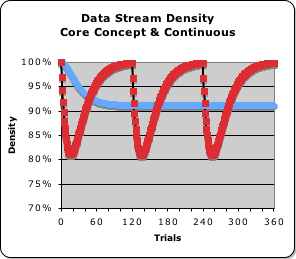
Now that we've seen the Deviation let's look at the resultant Density of each data stream. (Remember: the Density of the data stream is a function of the Deviation.) The Density of the Continuous Approach (the blue line) falls to about 90% and then remains there. In contrast, the Core Concept Approach cycles between 80% and 100%. This is 10% lower and 10% higher than the Continuous Approach.
What is the significance of these differences?
Although the State of the Continuous Data Stream rises to 4, the Deviation (the range of variation) remains relatively high. Hence, the Data Stream Density (the inertial component of Mass) remains at 90%, never reaching its full potential. We've suggested that the density of a data stream is associated with the concentrated energy of the data stream. Accordingly the Continuous Data Stream is operating short of full capacity. Could this mean that the data stream lacks the necessary energy to change the System?
Core-Concept Approach: State lower, but Energy Density 100% at Pulse’s end
In contrast, the State of the Core-Concept Data Stream only rises to 3 (as compared with 4). However the Density of the data stream rises to 100% at the end of each pulse (the duration of the Core Concept). The Energy Density of the Core Concept Approach goes both much higher and much lower than the Energy Density of the Continuous Approach. When the Deviation pulse is peaking, the Core Concept data stream is least substantial (only 80%, which is even less than the Continuous Approach (90%). When the pulse approaches zero (the Deviation is smallest), the data stream is most substantial (the Density approaches 100%).
100% Energy Density necessary to transform System
The energy of the Core-Concept data stream (its potential to change the System) ranges from diffused in the middle of the pulse to highly concentrated at the end of the pulse. Accordingly, the data stream has the best opportunity for changing the System at the end of each pulse of information (the Core Concept). The concentration of information energy is highest during these moments when the pulse is winding down. Could the intensification of energy at the end of the pulse be necessary to complete the transformation of the System?
Could Info Energy ignite Neural Firing at the end of Pulse?
Could this concentration of energy spark the firing of a neuron? Could this neural firing or multiple firings or repeated firings create a single quantum of info. Could this quantum of info register as a pulse that identifies a blue signal or perhaps the recognition of an object? Or could this pulse that is the result of multiple repetitions of a multitude of neural firings register a memory trace or perhaps secrete some biochemical secretion? Whichever transformation occurs, only at the end of the pulse does the data stream attain maximum Energy Density. The success of the Core Concept as compared with the Continuous Approach to presentations suggests that only at the end of the pulse of information does the system possess enough info energy to spark the gap between information and matter. Otherwise, the 90% Energy Density would allow the participant to absorb a continuous flow information indefinitely. Experimental results have repeatedly illustrated that this is not the case.
The Play of Attention & Energy Density


As the Energy Density intensifies, Attention fades
As mentioned, the Energy Density of the Data Stream continues to grow as it nears the end of the pulse (the red line in the Data Stream Density graph, repeated at right). If Energy Density is associated with assimilating information, as we theorize, why not continue taking in data indefinitely to solidify understanding? The reason is straightforward. As Energy Density grows, the data stream’s acceleration falls (the pink area in the Deviation graph, repeated below right). Attention, we theorize, is attracted to the acceleration of a data stream. Hence, as the data stream’s acceleration falls, Attention wanes. Energy Density up; Attention down. Shifting to a new Core Concept serves the purpose of reawakening the acceleration of the data stream, which in turn awakens Attention from her lethargy and begins the process anew.
Pulse of concentrated Data Stream insubstantial when peaking, substantial when fading
A concentrated data stream, such as a string of 1s or 10 minutes devoted to a Core Concept, produces a pulse - the Pulse of Attention. This pulse represents the data stream's acceleration. As the acceleration rises, the density of the data stream falls and vice versa. Data Stream acceleration is associated with Attention. In the initial phase of the Pulse, data stream acceleration, hence Attention, is peaking and the data stream’s density is least substantial. Conversely at the end of the Pulse, the data stream acceleration/Attention is negligible while the data stream is most substantial - the Density is highest. What are the implications of this play of Density and Attention?
When Peaking and Insubstantial, most open to the Flow of the Force
When new information is introduced into a stable data stream, the Data Stream’s Density, its Energy, initially falls. With declining density, the organism, we hypothesize, becomes more receptive to new input, new insight and inspiration. With substantiality reduced, the previous mental organization of material is not ‘dense’ enough to inhibit the flow of fresh information and insights. When the Pulse peaks, the Data Stream Density is at its lowest. If our reasoning is correct, the organism is least substantial and most open to the new material at this point.
For a Random Data Stream, both the Density and Acceleration remain low.
Note: although the Density is initially reduced from 100% to about 80% with the introduction of new material, the data stream’s acceleration is rising. The rising acceleration indicates that Attention is becoming more focused. This situation is entirely different from a random data stream, whose Density never rises above 10% and whose acceleration is negligible. Even though there is no Density to block the flow of fresh information, there is no acceleration for Attention to focus upon. Without Attention, the data stream never achieves significance to the organism.
After Peaking, Insights are concentrated to Spark the Gap – Fire a Neuron
As the data stream’s acceleration peaks, the density simultaneously falls. We speculate that we are most open to new information during this sector of the pulse. After this point, the Pulse fades. As the Pulse fades, the Energy Density grows to 100%. We speculate that only when this Density is complete does the data stream have enough energy to change the System. With the Energy Density at 100%, the Insights are concentrated enough to perhaps spark the gap between Mind and Body. On the most basic level, sparking the gap entails firing the neuron that organizes information in such a manner as to leave a memory trace.
Cultural Examples of Opening to Integration
This Core Concept process is straightforward. Concentrating information around a single topic generates a Pulse of Attention. This process initially opens the Audience up to new Information and then allows them to integrate it. Our culture recognizes this process in many ways. The introductory section of a play, lecture, book or concert is frequently designed to open us up to receive new material. The lecture, chapter, act, or movement frequently builds to a climax and then presents the concluding moral, conclusion, or grand idea at the end of the presentation. As a religious example of this process, Moses speaks with God on the mountaintop and then codifies this Divine Flow as the 10 Commandments. Mohammed opens up to Allah. After the experience, he reluctantly turns these divine insights into poetry, which eventually become the Koran.
Continuous Data Stream neither as substantial nor as insubstantial as the Core-Concept
The circumstances are very different with the Continuous Data Stream. The Energy Density of the data stream does not manifest as pulses, but remains instead at 90% for the duration of the stream (the blue line in the Energy Density graph above). This condition is true as long as new information is being presented. Note the density of the Core Concept data stream fluctuates between 80% and 100%. In other words, the Continuous Data Stream, which flat lines at 90%, is neither as substantial nor as insubstantial as the Core Concept Data Stream.
Continuous Presentation dims Listener's capacity for Openness and Integration
This mathematical fact combined with our prior analysis suggests two distinct possibilities. When an Audience is presented with a steady stream of new information, they will not be completely receptive to this fresh input, because the data stream is too substantial 90%, as compared with the pulsing Core Concept's 80%. Further, the Audience will not be able to integrate these new ideas as well because the data stream is too insubstantial 90%, as compared with the Core Concept's 100%. The steady flow of info doesn't give the Listener an opportunity to integrate the material, as the data stream's concentration of energy is never complete. The Listener is not quite as open to a continuous flow of new material, and isn't able to integrate the material at peak capacity. This inability has nothing to do with the Listener and everything to do with the way the material is presented. The Listener's innate abilities are secondary to the way in which the information is presented and then digested. It is the Energy Density of the Continuous Data Stream that never becomes substantial (concentrated) enough to change the System (to fire a neuron and leave a memory trace).
As an example, perhaps you perceive a tiger prowling across the savannah. You are continuously receiving new information as to the tiger’s location. But the concentration of his location (remaining in one place or approaching) is never great enough to cause alarm and cause you to take action, for instance running or throwing your spear. The tiger’s Data Stream Density never becomes great enough to change the state of your system.
Concentrated Info Energy Organizes the System
As is evident, Einstein’s insight that Mass and Energy are one provides great explanatory power for the Living Algorithm System. This symmetry between the systems provides an understanding why the Core-Concept Approach is so much more effective at transmitting information than is the Continuous Approach. The Energy Density of the Continuous Approach is too weak to have an impact upon the System. (Eyes Open; Nobody Home). In contrast, the Energy Density of the Core-Concept Approach is concentrated enough at the end of each pulse of Attention/Acceleration to spark the Gap from Mind to Body. We theorize that this concentration of information energy has the power to leave memory traces, whether of concentrated sensory signals or of a a more complex experience. In short, this concentrated info energy has the capacity for organizing the System.
These last statements are perhaps the most controversial of anything we have said thus far. And that’s saying a lot because this treatise is filled with controversy. To see why information energy is so controversial, check out the next article - The Two-way Interaction between Matter & Information.